Miyerkules, Agosto 8, 2012

Top Reasons Gantt Charts Improve Project Planning Efficiency

Finally you can see what you are doing!
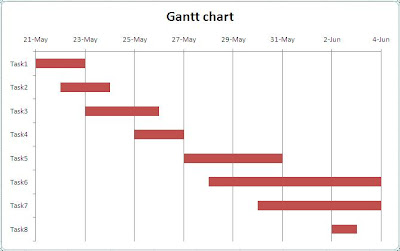
Looking at the start and end dates for tasks what you’re left with without a Gantt Chart. Each row of the project plan requires you to think about the dates, and position those dates in the context of preceding and dependent tasks.  The thought process of visualizing these dates in your head requires valuable thinking time and can result in a great deal of confusion if many tasks are involved in the project. A Gantt Chart enables the project manager to visualize the entire project plan, often on one page.  This visualization enables the project manager to see new relationships between tasks, and to continually refine the plan.  Major improvements can be made in your Gantt Chart by identifying tasks that might run in parallel, rather than sequentially.

Little time is required to produce and maintain Gantt Charts

Another main advantage of this type of chart is that they are easy to create. Two axes with tasks and time period to be mentioned and the amount of work done in certain period of time are marked. Certain tools are there with which we can create a chart within no time if the prerequisites are known.   In Microsoft Project, for example, one can access an built-in Gantt chart generator based upon an action item list the project manager puts together with the help of the project team. For the projects with specific due dates, the generator can help plot milestones as well as important dates related to the project's delivery.  To do this, the project manager has to determine the timeline in your Gantt chart for the various critical tasks included in the project and then work backwards so dependent tasks are accomplished in time to hit the target.

You can communicate more effectively with stakeholders
Many high performing business people operate visually. Your Gantt chart provides a means for these people to navigate simply through a very high level of complexity in your project plan.  As the data is "visualized for them", all stakeholders are looking at the same representation of the information.

The milestones and landmarks in a project can be represented very effectively in this chart. This format is preferred by many modern managers. As such, these charts need no further interpretation for presenting to sponsors, executives, and higher officials.  From a single sheet graph you can show where there is a lag in the project and fix it before the issue worsens. Since this chart is created in very short amount of time, this allows for more time for decision making to decide how to handle the trends being revealed as the plan is updated.

You can see ahead…for miles
A good Gantt chart tool will enable you to plan well in advance.  Sometimes visualizing longer term plans can feed back to changing your short term plans.  A good Gantt chart should let you plan far into the future, however you should also be able to change your view so that the entire planning range can be visualized on one page.  The main advantage of this chart is it is easily understandable. The information stored in it is very transparent and thus easily identifiable. Thus it is used in the important phase named planning phase in the project. By seeing the horizontal bars we can easily make out how much work has been completed in a given period of time which helps to keep track of the progression in the project activities.

You can identify resource clashes
Using a Gantt chart, you can easily see periods when a resource is scheduled on multiple tasks.  If this scheduling is a full time allocation to each task, then something as to give.  A Gantt chart enables you to see these emerging issues in advance and take corrective and preventative action, otherwise known as project management.

Martes, Marso 6, 2012

Systematic Problem Solving Approach with Cause and Effect


A handy technique for the purpose of a root cause analysis on a specified challenge is a fishbone diagram. A cause and effect chart motivates co-workers to function methodically and to search past the totally obvious reasons for a dilemma. The construction of the cause and effect chart makes it possible for prospective root causes to be discovered in a methodized approach.

Fishbone chart
The fishbone chart often known as an Ishikawa diagram after Dr. Kaoru Ishikawa, the Japanese quality control expert who invented it. The well-known term, "fish bone" comes from the fact that the chart has a resemblance to a fish skeleton.

Huwebes, Pebrero 16, 2012

Gantt Chart Technique


A Gantt chart is a charting technique widely used in project management.They're primarily used in presenting the schedules of each and every task associated with a certain project, plus the progress or perhaps the current status of every task. Can give the project manager an image with the whole project because all of the tasks required for its completion are indicated. Your order where the tasks must be completed can be illustrated. Overall, it help project managers by being more organized with their management.

Miyerkules, Pebrero 15, 2012

Establishing a Gantt Chart

A Gantt chart can be a pictorial representation that can show activities, tasks, people, machine or another resources necessary to accomplish the task on the time-oriented grid. Charts bring various levels inside project. Some individuals prefer starting from the minimum level and dealing their way up until they complete the total project. The suggested technique is to start out from the total project and work your way down to the lowest level. In this way, you might be assured that you have considered several different milestones to accomplish the project. You needs to have this overall Gantt chart reviewed because of your team members and management. This initial Gantt chart is crucial as it becomes the inspiration for many detailed Gantt charts.

After the main Gantt chart is eligible, you are able to go to define the important points for the accomplishment of each milestone. Estimated resources have become brought right down to more specifics. There may be deviations from your actual requirements and those estimated at the advanced Gantt chart. Hopefully the differences are minor, or else you have to go returning to management and also the stakeholders and request for an additional budget. Management and stakeholders don't like being forced to approve readjusted budgets since it affects their bottom line expectations. Make sure your estimations are as accurate as possible.

Define the team leaders for every milestone and walk-through with each team leader on the manpower and equipment resources. Review the timeframe for the completion of each activity. You need to make sure their timeframe coincides with the overall time frame for the total project. If they exceed their time frames, it may affect the project deadlines. Unfortunately, the Gantt chart will not show the dependencies and interrelationships too well and you'll have to utilize another project management software tool. Project managers normally use several tools in monitoring and updating their projects as each chart includes a specific purpose. Make utilization of the WBS (work breakdown structure) in developing the activities for your project as it is easier to adjust the tasks. By placing how long required like a horizontal bar around the chart, you can readily notice the overlapping of tasks. This is normal inside a project as various resources are assigned to different tasks. Identify the time for each task. A very important factor you ought to watch out for can be a conflict on specific resources. For instance, a bulldozer are usually necessary in a number of tasks and you also just have one available. When this occurs, the duties can't be concurrent as the bulldozer can attend to one task at any given time and also the other tasks have to wait their turn. There's a resulting dependency on resource which impacts the agenda for the remaining tasks. The manager must find other bulldozers or ensure that the only bulldozer is moved from task to another efficiently to save time.

A Gantt chart is an excellent tool in planning and scheduling operations. The charts can be maintained provided the actions remain static. However, the truth is, a project is usually dynamic. Updating of a Gantt chart will reveal difficulties which is often resolved through rescheduling, overtime, multiple shifts, and extra resources. Updating of the Gantt chart is straightforward nowadays by using project management software computer programs.

Martes, Pebrero 14, 2012

Drawing Up a Gantt Chart


The Gantt chart could be a helpful application for plotting out and preparing projects. It can help one to prepare those activities and also the schedules in the project. Moreover, it may direct you towards planning resources per task in line with the type and number of resources.

Each time a project happens to be being done, a Gantt chart will help you check the progress of the project. Any task not finished on schedule can be found and corrective actions may be taken up place the other activities back on schedule.

Whenever you establish the tasks to your project, you will see sequential and parallel activities. Sequential activities are duties that needs to be finished in sequence. The task should be completed to ensure that next task can be started. They are dependent activities simply because they depend on the culmination of the past task ahead of the next task could be commenced. Parallel activities are jobs that may be commenced simultaneously. They don't rely on the culmination associated with a other process for them to be started. As a result, the manager gets the choice of when to start the work providing they fulfill the scheduled project deadline. The main advantage of this is that managers can schedule those ideas in the period when resources is found. The risk, however, is the fact that people might will probably postpone the work before end when all parallel activities are required to the end, it would produce lack of resources. Some parallel activities could possibly be influenced by the final outcome of some tasks before they could commence.

If you are creating the Gantt chart, focus on their inventory at work. Start off with all the major work. Alongside each task, place the length. For your sequential tasks, identify the activity so it is relying on. If you undertake to do your listing systematically along with care, the actual result's gonna be a listing of tasks positioned in sequence. Assess the list and see what tasks can be achieved in parallel and put those for the bottom of the list.

Squeeze time divisions at the upper part of the chart. The resolution of that time period could possibly be months, weeks or days. It should not be too much that you simply lose grip of that time period, nor too thorough this chart becomes extended unnecessarily. For example, when the project normally takes three months to do, it wouldn't be practical to employ a time unit of months since you will have only 3 columns (one per month) and you may have issues overseeing the progress. Using days as the time unit could be too detailed for the reason that there's probably not significant progress to exhibit every day. When you have selected a good resolution of time, follow it for all your tasks. You need to use merely a single measurement when defining enough time units. What some managers do is divide the time unit into smaller units or sub-columns for several tasks that require better supervision on the progress. The primary column retains the same time unit and you also either divide it to obtain smaller time units or combine columns to acquire a larger time unit. As an illustration, should your standard time unit is weeks, a column representing 7 days might be subdivided into days. For instance, it is possible to join 4 columns into a month. Realize that in these circumstances, the main element time unit or column still remains as weeks. You need to stick to this method in your mind when presenting different time frames for many activities, otherwise your time and effort line will probably be askew.


Lunes, Pebrero 13, 2012

How to Enhance a Gantt Chart

Enhancing the Gantt chart will help utilize the same chart for a number of things in an even more efficient manner.

The applications used in the chart can be twisted a little to include the various features for making the chart really easy to use. These things differ from one application to another.

However some things can be achieved to each and every individual Gantt graph to enhance the results and reduce problems:
  • One should attempt then add instructive records towards the various tasks talked about in the graph and or chartThis really is useful in case of the numerous tasks that do not have any restrictions whatsoeverThe restrictions can time affect the different links, therefore ultimately causing the particular conflicts in routine or the illogicality within the basic plan. Therefore it is important to have them in mind while including virtually any improvements in the graph.
  • It's also advisable to go ahead and spotlight the actual critical path to enable you to browse the different jobs which may really get a new finish date of a projectIn the undertaking strategy, the actual essential course generally matches the different jobs.It can also cope with the connected duties which cannot really pay for any kind of delay as this can cause the entire task being late.

    Gantt Chart with Critical Path in Red
  • Usually a task can get affected in a really big way if the starting date is changed or the project's end date ends up affecting the duration. In some cases it can also affect the start date if the scheduling is done starting the project's end date.
  • One has to keep the chart simple to closely observe the various critical tasks at any given time therefore resulting in a efficient project management. In case the overall duration of the project ends up being too long, the critical path should be shortened to reduce the entire duration.

You may also use Gantt Charts for your family history:

A good viable starting point while seeking for your Western Virginia loved ones heritage is simply by conversing with older loved ones they can be an excellent useful resource to your family's heritage info. In addition to additional research methods, looking at neighborhood traditional records such as the division associated with health recordsthe neighborhood important figures records just like delivery data and also death certificatesnearby court recordsmarriage recordsschool dataand native cathedral informationAlways create a Gantt chart to discover the very best path to addressing in places you need to get.

Linggo, Pebrero 12, 2012

Managing a Project Using a Gantt Chart Using Microsoft Excel


It is easy to run a project with the aid of a Gantt chart.You need to simply come up with a project plan.Normally a project plan includes a listing of such things as:
  • The various activities and phases part of a project
  • The schedule starting date of your activity
  • The scheduled duration that an activity will continue for

In the perspective of tracking the workyou can add:
  • Your starting date of the activity
  • The real time period of the actual activity
  • The percentage of the activity completed on a given date

You can actually use score well in a great way for managing the project plan. Microsoft Excel alsoenables you to produce a dynamic Gantt chart which may:
  • Automatically update itself once the date changes
  • Easily display a different bar that will rise on such basis as the share with the tasks which is completed regarding every activity.
  • Highlight the present day or week in a subtle way

You can easily create a Gantt Chart in Microsoft Excel. Listed below are the steps to take action:
  • You have to first produce a Gantt chart layout.
  • After this you need to give a number of several columns in the long run; you need one for every singleday of the project.
  • Then you've to offer designation to various cellswhere you can easily maintain the various values
  • You also have to incorporate the various formulas inside the different cells. You need to find out the formula according top the task you might be undertaking.
  • You'll then need to adjust the different formatting options such as the width from the column, its colorsand its fonts. You need to freeze the top row to easily scroll along the chart.

Huwebes, Pebrero 9, 2012

Tips on Creating a Gantt Chart


Creating a Gantt chart is not extremely tough. Listed here are some tips which will help you out.

  1. You can start with all the task that has got to be completed last and also the one that has to be done first. Then you definitely need to determine the task which could just be completed when another task is completed. These jobs are called interdependent tasks.
     
  2. You then have to decide whether you would go with a complex or a simple Gantt chart is necessary. If you use an easy chart you will get yourself a select few of columns while an intricate chart includes other columns too.
     
  3. First enter the name of the task in the left-most column. You must proceed with a single task in most row, enter in the person's name that is responsible inside the second column then go on to arrange the remainder of the columns based on the criteria of month, day and week. If you use a complicated chart, you should are the columns for a few other data based information.
     
  4. Next, you need to draft a line or even a hollow box which represents the expected amount of time a job will take. You have to then simply line up the box by the various starts and end dates. You also have to pay attention to the interdependent tasks and arrange them.
     
  5. Be sure assembling your project time-line is flexible enough. In case, you will find the due date right at the end of the month, you have to complete the work, 2-3 days earlier then expected. This allows dealing with any unsure happening.
     
  6. Make sure that you review the timeline in a regular manner for ensuring the projects tasks are done with in a timely manner.

Miyerkules, Pebrero 8, 2012

Gantt Chart Template for Effective Project Management


It is very challenging for project managers to simultaneously handle multiple projects. They must not merely keep track of enough time lines and important milestones of entire project but in addition need to check up on the progress of men and women which were assigned different tasks of the project. Gantt chart template comes to their rescue where they can write down minute details related to the project and circulate the same among the team members.

A Gantt chart essentially lets them assembled the information around the entire project and then reduce into different individual categories. Moreover the representation of project details in pictorial form ensures they are more understandable than written text. There are a number of template available on the net or one can create them in Microsoft word or excelWell-liked themes the situation it is vital how the template profit the project team in setting realistic goals pertaining to timely completion of the project.

Gantt chart is essential within the sense which it depicts the whole life cycle from the project from about to research then to implementation combined with the status, timeline and important milestones of each phase.

It's possible to start preparing a Gantt chart with listing important specifics of the project and categorising them into phases. Identify different tasks in each phase and accordingly identify resources who'll accomplish them. An easy chart depicts tasks vertically in the left percentage of the chart nevertheless there is a corresponding horizontal bar within the right section that depicts time frame, milestones etc. A complex chart on the other hand displays task interdependencies by using coloured arrows.

With Gantt chart software it's possible to visualise the time taken for completing each task, overlapping schedules and overall time drawn in completing the project thereby ensuring effective control over multiple projects.

Lunes, Pebrero 6, 2012

The Gantt Chart: Already Dead Or Still Alive?

Recently, I was confronted with the provoking statement: "Henry Gantt is dead since almost 100 years, and virtually his charts are too." I did not reply, but decided to give this a thought.

The hypothesis that something is considered to be dead automatically means that it turned out alive before. As we are not referring to someone here but of a visualization technique, dead and alive quite simply signify this method were built with a value previously but is regarded as no longer needed nowadays. Hence, it may be worthwhile to lock into the past when knowing how to make a Gantt chart not just was seen as valuable, but in addition as revolutionary tool. This may reveal even more insights why it may have ended since then.

Environmental surroundings, for which Henry Laurence Gantt invented his charts, was the assembly industry and also the prime use case was the advance of managerial decision-making within the scheduling process. The design of the Gantt chart followed the question which information a foreman or supervisor needed to see to be able to quickly understand whether a production was on schedule, beforehand or running late. Gantt introduced the thought to make use of time and resource usage no longer quantity being a yardstick for making scheduling decisions, and created various types of charts depending on the individual needs of the production managers. These executives at that time were required to manage bottlenecks, were meant to deal with uncertainty, and needed to handle everything resulting from the still high degree of human contribution to industrial production. For this environment, Henry Gantt created a chart that summarized all relevant information at one glance to enable managers making profound scheduling decisions.

In summary, the Gantt chart have been alive if the following characteristics were met: It must be production environment where decision support for scheduling processes were needed and required context-sensitive information ("for individual needs") at one glance taking into consideration time and resource usage as crucial determinants.

What has changed since that time to declare the Gantt chart dead?

Although we are heading for the so-called service society, the cumulative net output of the manufacturing industry still counts for longer than 25% from the global GDP (source: World Bank). Undoubtedly, this sector continues to have its relevance. Competition is increasing and lots of products a growing number of become a commodity. Both trends drive a margin pressure particularly in the manufacturing industry. This allows making the first assumption that scheduling processes are becoming a lot more important, and therefore the equipment providing decision support for scheduling tasks.

This assumption may be endorsed by three core evidences: First, it seems like being sound judgment that point can be a key success factor for production companies. An underlining evidence because of this common sense can based on considering common key performance indicators such as time-to-market or production methodologies like just-in-time. This enhances the question why a time-focused scheduling tool is certainly outdated. Second, considering that the good old days of Henry Gantt the ratio fix costs to variable costs continues to be becoming more and more fix cost-savvy. This can be as well as true for production environments. In fix cost-intensive areas, people normally have to place a higher focus on the ideal resource usage to make maximum utilization of the fix cost-driving capacities. Again, the question must be raised why a resource-focused visualization to support scheduling decisions ought to be outdated in such a scenario. Third, one should take a look at decision support itself. The delivery of context-sensitive information has arisen as one candidate for becoming a new paradigm for the style of decision support systems. This becomes a lot more relevant if a person takes the tremendous data growth into consideration. Henry Gantt meant to create exactly this. His charts were meant being a context-sensitive tool to boost time- and resource-based scheduling decisions. For your third time the question needs to be raised why this really is considered as outdated. The alternative appears to be true: For manufacturers, there is certainly more requirement for a Gantt chart than previously.

Finally and fair enough: lots of "the Gantt is dead" advocates range from project management industry. This unique use case of a Gantt chart hasn't been analyzed here. The main focus here would have been to prove that the Gantt chart as Henry Gantt invented it, still is alive and needs to become alive within the production industry.